
Portfolio & Stats
Two pages in the sidebar give you the overall picture: Portfolio shows what you hold right now, Stats shows how your closed trades did over a period. For the details of one position (entry, mark and liquidation price, leverage, funding), use the Portfolio tab under the chart in the terminal.
Portfolio
Open Portfolio in the sidebar (/app/portfolio).
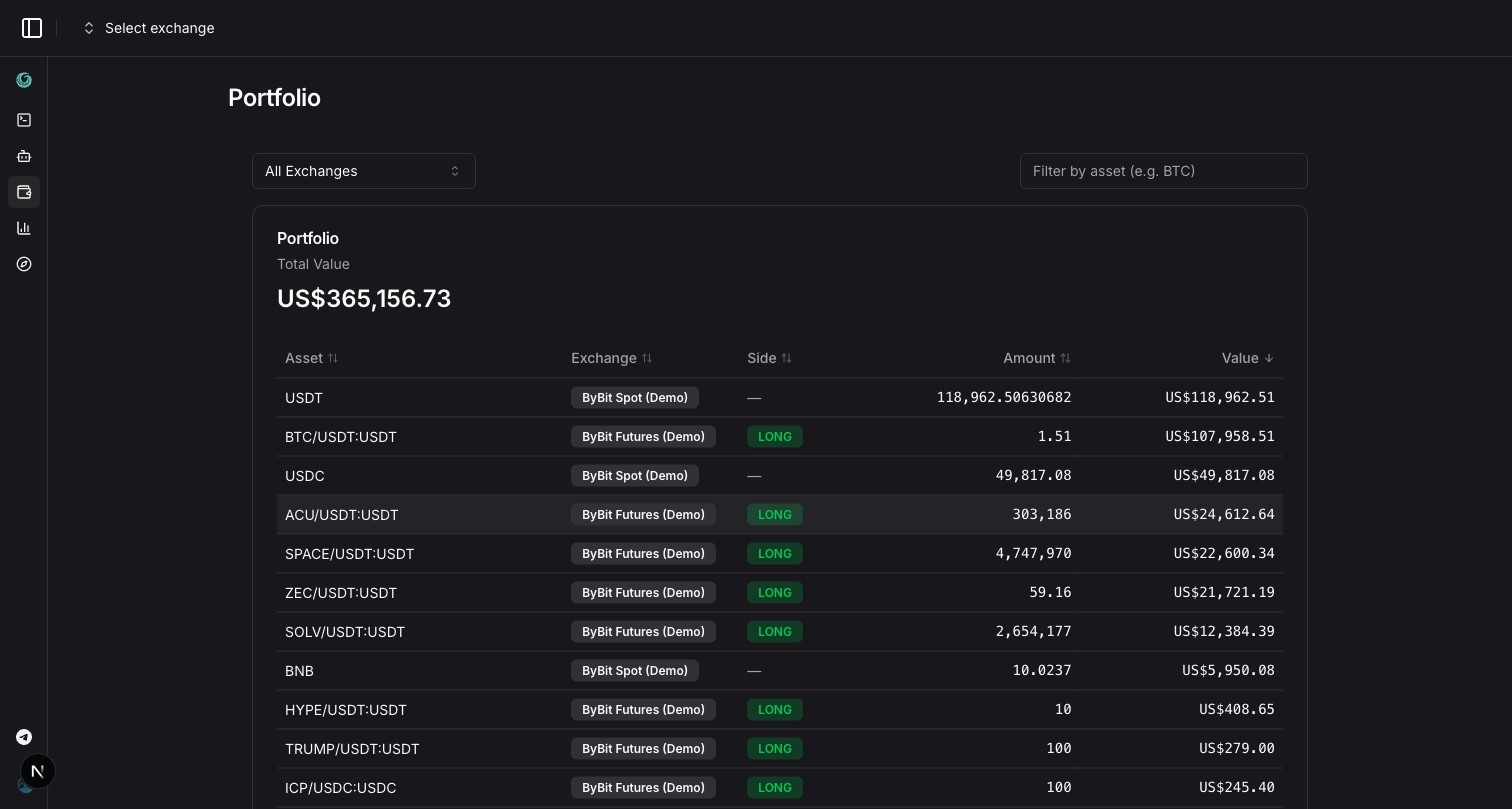
- Scope (top left): All Exchanges or one of your accounts.
- Filter by asset (top right): type a coin, for example BTC, to show only its rows.
- Total Value: the value of everything in the table, in USD.
- The table: Asset, Exchange (the account it's on), Side, Amount and Value. Click a column header to sort by it, click again to reverse. By default the largest value comes first.
What goes into the table depends on the account type:
- Spot accounts list every coin with a non-zero balance, stablecoins included. The value is the amount times the current price.
- Futures accounts list open positions with their side, LONG or SHORT. The value is the size of the position at the current price, not the margin it uses. The margin balance of a futures account isn't listed.
In All Exchanges, the same coin on two accounts appears as two rows. If an exchange can't be reached when the page loads, its account is left out of the table and the total. The page doesn't refresh by itself: reload it to see the latest balances.
Stats
Open Stats in the sidebar (/app/stats). It shows the results of your smart orders over a period.
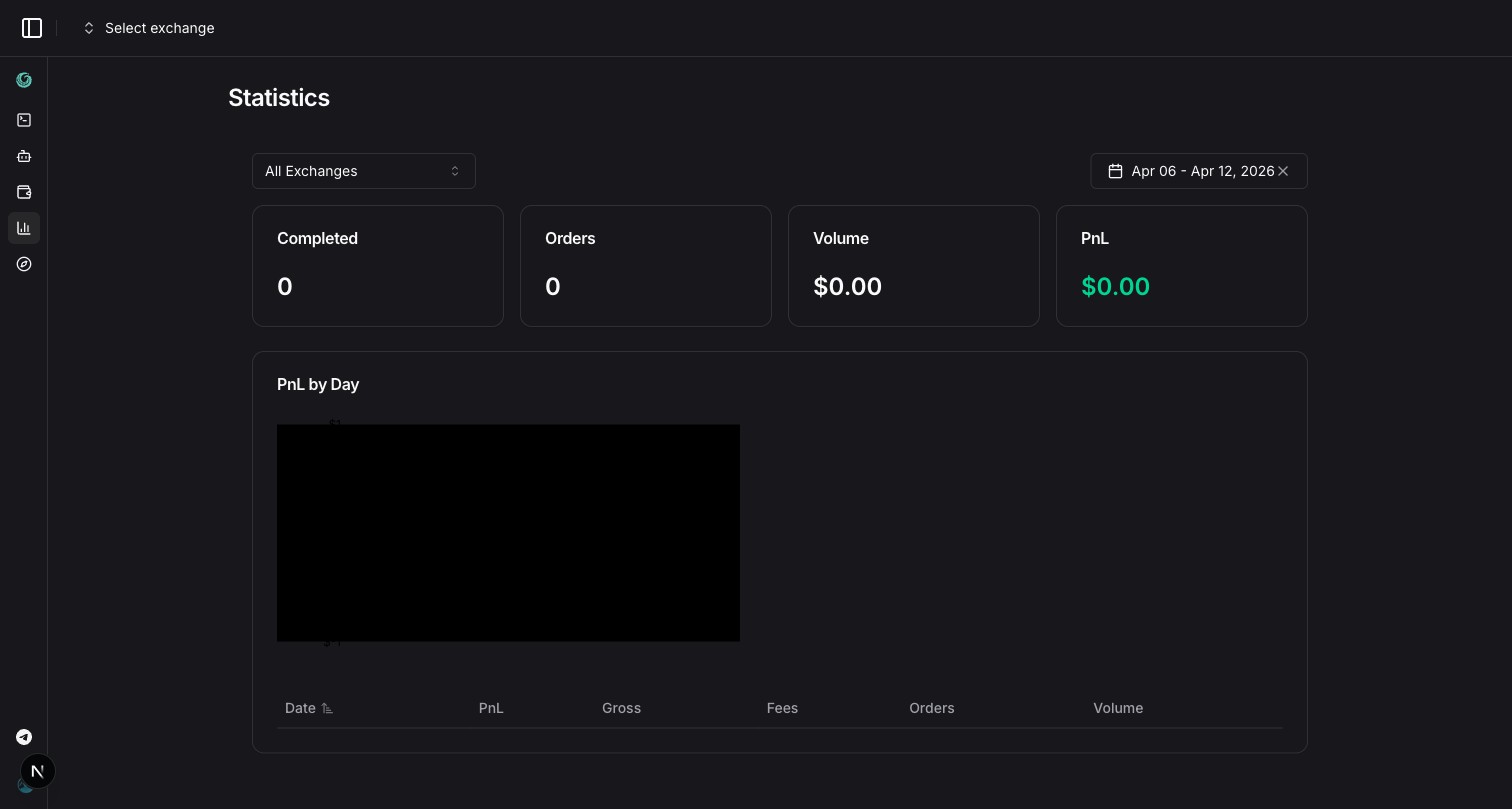
- Choose the scope: All Exchanges or one account.
- Pick the dates in the date range picker. By default it shows the last 7 days, today included.
Summary cards
| Card | What it counts |
|---|---|
| Completed | Smart orders that closed within the dates |
| Orders | Fills within the dates: entries and averaging orders, take-profits, stop-losses, exits |
| Volume | The total size of those fills (amount × price) |
| PnL | Realized profit or loss of the positions closed within the dates, after fees. Green when positive, red when negative |
PnL by Day
A bar chart of realized PnL for each day of the range. Under it, a table with one row per day:
- Date;
- PnL: realized result of the day, after fees;
- Gross: the result before the fees of the closing orders;
- Fees: the fees of the closing orders;
- Orders and Volume: the closing fills of that day (take-profits, stop-losses and exits), so they don't add up to the Orders and Volume cards, which also count entries.
Click a column header to sort the table.
What Stats counts
- Smart orders you placed in Tradiflux, including the ones you confirmed from the AI assistant and the positions you imported into the terminal.
- Not counted: bot trades, and trades made directly on the exchange.
- Realized results only: open positions don't affect PnL until they close. Funding payments aren't included.
Recurring buy
Buy or sell a coin at market on a schedule on a spot account — every N minutes, hours or days, with an optional budget, number of orders or end date.
Account & billing
Sign-in methods, settings, account security, the Free and Basic plans, paying in crypto, AI credits and how to reach support.