
Explore charts
Explore is a public chart page: TradingView Advanced Charts on live exchange data, an order book with depth, and a grid bot backtest for the coin. It is free and works without an account.
- Market — the exchange and market type (perpetual or spot)
- Symbol — search the market's pairs with price, 24h change and volume
- TradingView tools — drawing tools, indicators, intervals, chart settings
- Layout — one chart or a multi-chart grid
- Order book — live order book with a depth chart above it
- Grid bot replay — a default grid bot over the coin's last 30 days
- Trade in terminal — open this symbol in your Tradiflux terminal (guests see Sign In and Get Started here)
Open a chart
- Go to /explore — it opens Bybit Perp with BTC.
- From the app: Explore charts in the sidebar.
- From the terminal: click Advanced chart in its header (on a phone, under ⋮). It opens the same symbol on Explore.
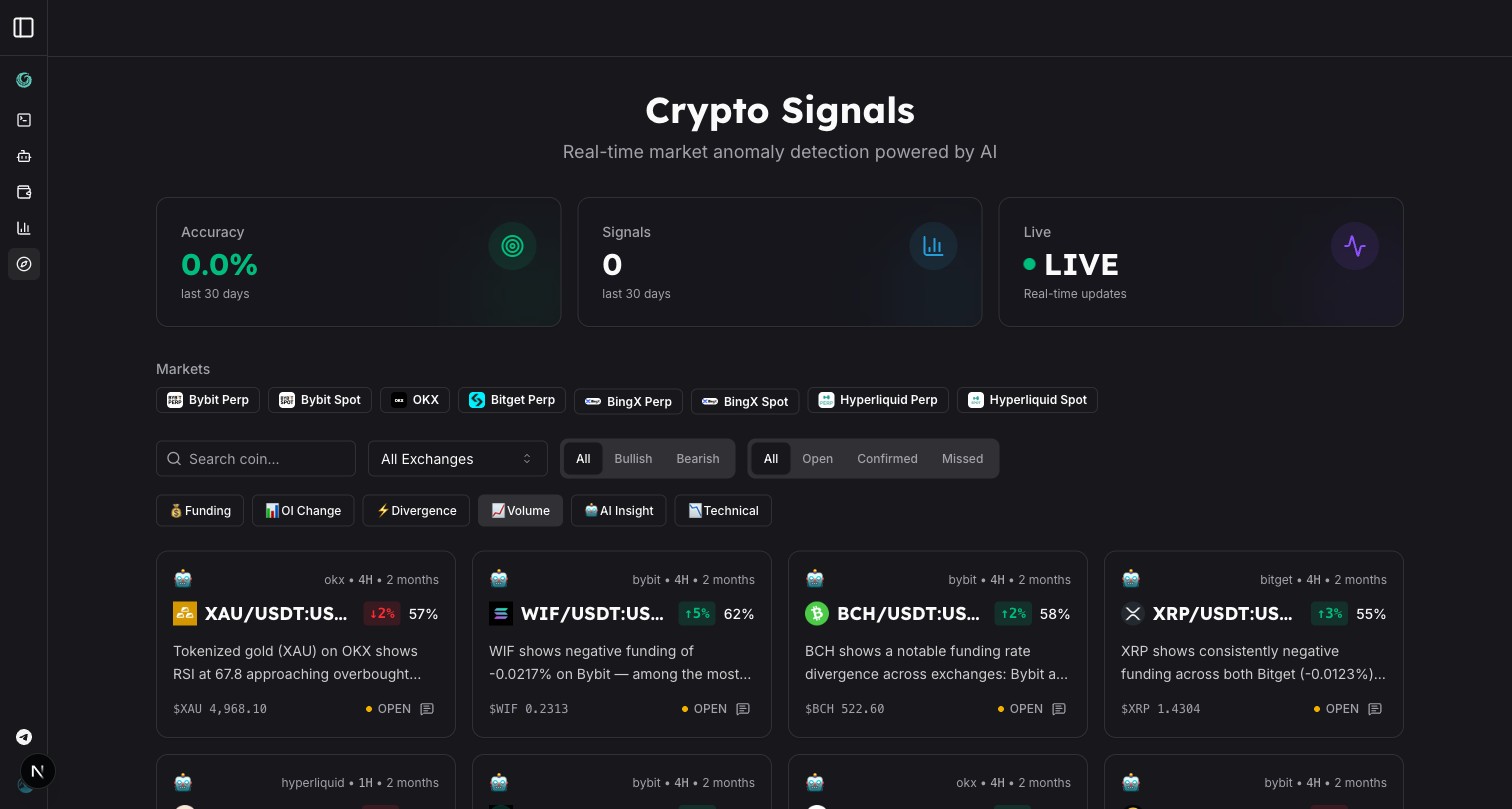
- From the Signals page: pick a market under Markets.
The page address keeps the market and the symbol, e.g. /explore/bybit?symbol=BTC/USDT:USDT, so a chart can be bookmarked or shared.
Markets
| Market | Address |
|---|---|
| Bybit Perp | /explore/bybit |
| Bybit Spot | /explore/bybit-spot |
| OKX (spot) | /explore/okx |
| Bitget Perp | /explore/bitget |
| BingX Perp | /explore/bingx |
| BingX Spot | /explore/bingx-spot |
| Hyperliquid Perp | /explore/hyperliquid |
| Hyperliquid Spot | /explore/hyperliquid-spot |
- Click the market name in the header to switch to another market.
- Click the symbol to open the pair list. Type to search; each row shows the price, 24h change and volume.
Chart tools
The chart is TradingView Advanced Charts: the full drawing toolbar, indicators and study templates, intervals, chart types and settings. Times are shown in UTC.
Your drawings, indicators and chart settings are saved automatically a few seconds after each change:
- Guests — in this browser.
- Signed in — in your Tradiflux account, so they follow you to other devices. When you sign in, charts saved in the browser move to your account.
Multi-chart layouts
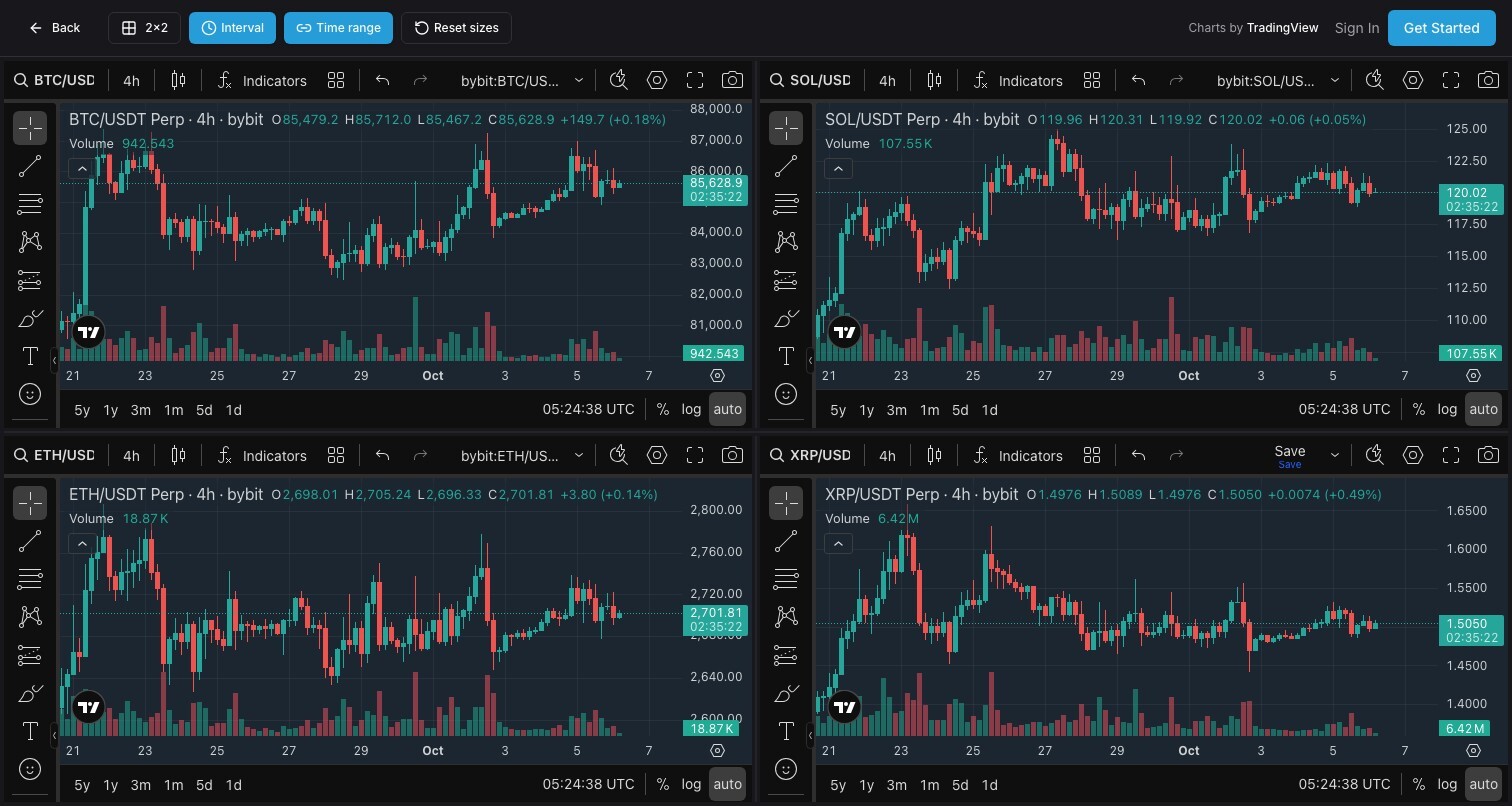
Use the layout button in the header to show several charts at once: 1, 2H, 2V, 2x2, 3x2 or 4x2.
- Each chart has its own symbol and interval. Change them with the chart's own symbol search and interval buttons; the search covers all Explore markets.
- Interval — sync the interval across all charts.
- Time range — sync scrolling and zoom across all charts.
- Reset sizes — restore equal chart sizes after dragging the borders.
The chosen layout is remembered in this browser. In multi-chart mode the order book and the side panel are hidden; switch back to 1 to see them.
Order book and depth
On a wide screen the order book sits to the right of the chart, with a depth chart on top. Hide it with the arrow on its edge (Hide order book) to give the chart more room; the choice is remembered.
Grid bot replay
The side panel shows how a default grid bot would have done on this coin over the last 30 days, next to simply holding the coin:
- the bot's result and the hold result in %, with an equity line;
- Range, Setup (levels and budget), Closed trades, Max drawdown, Hours in range.
The range is set from volatility before the start, without hindsight. Fees are counted per fill; funding is not. Past results don't predict future ones.
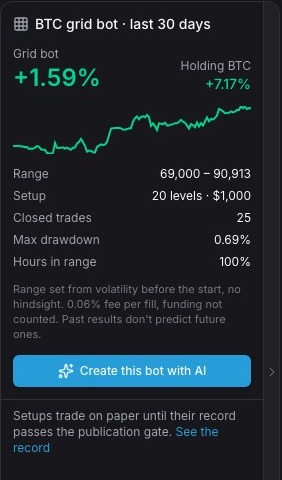
Create this bot with AI opens the app with the AI assistant and a request for this bot already filled in. The assistant shows a backtest first, then a grid bot card for you to confirm. Guests sign in first; the request waits for them. Bots and the assistant need the Basic plan.
Below the card, the panel lists live signals once a setup passes the publication gate (signals for the coin on the chart are highlighted); until then it links to the setups' record. Hide the panel with the arrow on its edge (Hide the bot backtest).
Trade in terminal
When you are signed in, the header shows:
- Trade in terminal — if you have an account on this exchange and market type. Your terminal opens on this symbol with the order form shown and a Back to the chart bar on top that returns you to Explore.
- Connect exchange — if you don't have such an account yet. It opens the terminal, where you can add one.
Guests see Sign In and Get Started instead.
AI assistant drawings
When the AI assistant draws on a chart, its TradingView Advanced Charts button opens the drawing here (the address ends with &drawing=…).
- A chip on the chart shows the drawing's title.
- If you switch to another symbol, the chip says Drawing for … with Show to go back.
- × on the chip hides the drawing.
Drawing links work for anyone who has them, signed in or not. They contain only market data.
On a phone
The chart takes the whole screen. Use the bottom tabs: Chart, Book (order book) and Bot test (the grid bot replay).
Telegram
Link Telegram to Tradiflux to get trade notifications, talk to the AI assistant by text, voice or screenshots, and open the full app inside Telegram.
Signals
Rule-based crypto trade setups with an honest track record — every signal is scored as a trade after fees and funding, and a setup is published only after its paper record passes the gate.